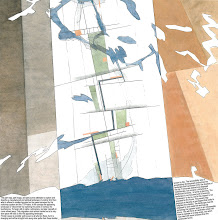
Our daughter Sara made this image in the spring. An early reading of the latest news on aspects of the global forces. She is now in den Haag ready for Bachelor studies in Graphic Design at The Royal Academy of Art.


 Yesterday two of our friends tipt us simultaniously about a blogpost on BLDGBLOG about Inuit tactile maps of the Greenland coastline. Marianne Skjulhaug called from Bergen and Ross Langdon sent a mail from Uganda (!). Follow the link and learn more. It is truly intriguing.
The carving is 300 years old and shows the coastline with fjords, islands, nunataks and glaciers. The outline of the coast is carried up one side and down the other.
Later today, Aviaaja and Helena from tnt nuuk is coming to stay the week in Tromsø on our 3'rd workshop about Nuup Qeqqani. We are sure they can tell us more about these maps and maybee we can see them for ourselves the next time we go to Nuuk...
 This Postcard is a starting point for an exploration of the Nuuk to come. The shivering line guided the followers of the Nuuk Safari. This site in the capital contains many aspects of Greenland colonial history, and is a political hot topic. The long line in the middle is Blok P, which at one point in history contained 1% of the Greenland population. The conversations on the Nuuk Safari unfolded all shades of this history. One social worker characterized Blok P as "an evil circle shaped as a building". The housing minister of the Self Government, who took part in the Safari, has stated that Blok P is to be demolished in 2011; it is a main political ambition. A series of proposals from different architects in the last 20 years has proposed solutions for revitalization of Blok P. None has come to life - and the standard is on a level of being derelict. A large part of the surrounding blocks and row houses is also in the searchlight of demolition - in time to come. So, this postcard, and the walking line, is empowered by memories, anger, hopelessness and possibly new hope. It’s an explosive postcard, now in the hands of the people of Nuuk.

 EnergyMap is the national Danish internet portal for energy and climate related solutions. On Energymap Danish companies, organisations, institutions and public authorities are given the opportunity to present their work and ideas on technologies and programmes that may help combat climate change and improve energy-efficiency. Users of EnergyMap are invited to explore the solutions, cases, projects and events presented on the portal. Many of the featured sites are open for visitors and many also offer investment opportunities.
Explore EnergyMap here

The United Nations Framework Convention on Climate Change secretariat has cooperated with Google and the Danish government as hosts of COP 15 to display official UNFCCC greenhouse gas (GHG) emissions data for Annex I Parties using Google Maps. The Maps are now online and can be accessed on the UNFCCC GHG data interface. Users can select on a world map total national GHG emissions/removals as well as emissions/removals from various sectors; absolute numbers (in Gg CO2 equivalent); or relative changes in emissions (in per cent compared to the base year level). Information is provided for all sectors (such as energy, agriculture, etc) and for the major sub-sectors (such as transport within the energy sector). By gas, the data cover aggregate GHGs, CO2, CH4, N2O, SF6, HFCs and PFCs.
Link to the world map total national GHG emissions/removals


The competition of Ørestaden in 1994 can be seen as Copenhagen’s urban answer to the Öresund Bridge project. The program for Ørestaden was as ambitious as for Nordhavnen, but in a different time. Here the ambitions of Copenhagen as an important city in a European economic picture were dominant (new Docklands etc.) The ideal world of Ørestaden, as a line of growth out towards Amager’s periphery, have not however been sustained in dialogue with the larger image of the city. More interesting urban developments have taken place in other parts of Copenhagen, and ideas and ambitions have disintegrated in Ørestaden’s era.
Nordhavnen has now been designated as the place for seven present ambition’s criteria summed up as ‘The Sustainable City of the Future’. As in Ørestaden a linear direction of development has been chosen, but this time directly into the Øresund Strait, functioning as a game board for these ambitions. The program’s statement is that all ambitions that have not taken place other places will happen here, - not unlike the ‘best of all’-programs for Ørestaden.
This Map (and text) is from the 1st price project in Nordhavnen,(1st face), Copenhagen: Excentral Park - Edge Dynamics, which we did together with 70°N and a panel of experts.

This map was our starting point for an investigation on a city development in Stavanger in 2000. It led, together with Paolo Viganos lecture in Cordoba (Europan, 2003) to the text ”Topografiske attraksjoner” (topographical attractions), published in Arkitektnytt in 2003.
In the spring 2010 we will revisit the study field of Jæren through the course, Appearing and Disappearing Landscapes, which is part 2 of AHO's "Research on the Norwegian Landscape". The course is an inter-Nordic cooperation between the AHO and Forests and Landscape at Copenhagen University. Jæren is a region that today has the largest urban growth in Norway after Oslo. The region, which is the centre of oil development in Norway, is now entering into a new phase, causing both landscape and urbanity to be in need of reinterpretation. The course will establish recognition on the larger scale that will affect knowledge built up during the course work. The UN climate conference, COP 15, in December 2009 will send out signals concerning this larger scale.
The Course is planned as a discourse between landscapes and urban conditions that range from the smallest biotope to the larger future image. Students will throughout the semester work on individual projects as experiments in the relationship between different territorial contexts and urban strategies; this will entail both a smart and innovative cartography and conceptual design projects.

Each element, every trace describing the appearing manufactured and spiritual landscape is to be considered as resisting change, interposing processes which resists and reformulate actual interventions in space.
A canal or a lake can thus fashion a word of ideas for what is to follow. A planted forest will after 20 years demand respect and care. An area in which all of nature is subject to change during 30 years will by virtue of that change draw attention to itself and become an alternative to all development strategies. Our concept entails exploring how such an incipient landscape shapes its capacity for resistance, in other words how it is shaped in time.
We made this map over Ørestaden in 1994 as a part of The Magic Carpet.

This map from 2006, which we made for the arctic cities exhibition at the 10'th architectural Biennale in Venice together with a great team, shows the early estimates for the meltdown of the ice cap. Today we know for a fact that the process is going much faster. Two years later Jan Gunnar Winther, Director of the Norwegian Polar Institute in Tromsø, stated: ”The summer of 2007 was a record year climate-wise: the ice in the Arctic was down 20% from the previous record year in 2005. The September Ice in 2007 was historically small in scale and one thus expects a new record low in 2008. Mathematical climatic models has not been able to take into account these fast changes. They don’t reproduce reality well enough.” The climate change sets new conditions for spatial planning. Read more in Appearing and disappearing Landscapes in On Site, the book will be launched at the Architekturforum in Zurich tomorrow.
related link: Earth Observatory // World Of Change

Along the ridge of Tromsø Island there runs a band of continues woodlands – the Tromsø Common – which in size and extension corresponds to that of Central Park in New York. Back in 1994 we superpositioned Manhattan on this map over the Tromsø Island. Tromsø was experiencing an explosive urban growth, and it was necessary discuss the lokal attitude towards nature as an unlimited resource. The Tromsø common vas already changing from being nature to become a park. 14 years later the map still has actuality in the urban discource i Tromsø - it has proved to be a valid statement.
The fact that we have an urban park of an international format is the most visible urbane trait in Tromsø that necessitates a further urbanisation. The Green Line bind all the city areas together, in winter functioning almost as a metro for cross-country skiers and families on a hike.
Skating in Central Park

Web-fiction, based on the performance at PAN-BARENZ
Artist/musician Amund Sjølie Sveen speaks to us back from 2036 and tries to analyze the changes that have lead to establishment of the USB and proves that the opening of a new IKEA-store in HaparandaTornio in 2006 is a major event in the history of the Barents Region. What happens when the region experiences a potential change from periphery to center? Why are we all talking English to each other? Welcome to the brave new world of the United States of Barents!

This screenshot of the MAREANO map viewer shows the area of hydrographic survey data at the Norwegian continental shelf, an area bigger than the Norwegian mainland. On the MAREANO map wiever you click into registrations, images and videos of the seabed.
Global heating increases the pressure on coastal areas and ocean zones, the seabed itself and the quality of the ocean areas are at stake – the resources here constitute the world’s future "granaries" and "larders". It is the mapping and change of this seascape that now appears as the big challenge – a future and appearing landscape undergoing a dramatic and complex process of change. This environmental mapping’s collision with the mapping of fossil resources can from hegemonic milieus be seen as a disturbing mapping.
MAREANO maps depth and topography, sediment composition, biodiversity, habitats and biotopes as well as pollution in the seabed in Norwegian coastal and offshore regions.The MAREANO Programme aims to provide answers to questions such as: How is the seascape of the Norwegian continental shelf? What does the seabed consist of? How is the biodiversity distributed on the seabed? How are habitats and biotopes distributed on the seabed? What is the relationship between the physical environment, biodiversity and biological resources? How are contaminants stored in sediments? MAREANO is coordinated by the Institute of Marine Research, in collaboration with the Geological Survey of Norway and the Norwegian Hydrographic Service.The Programme is financed by the Ministry of Fisheries and Coastal Affairs, the Ministry of Environment and the Ministry of Trade and Industry via contributions from the National Budget.
Se også Forvaltningsplan Barentshavet og havområdene utenfor Lofoten og Helhetlig forvaltning av det marine miljø i Norskehavet
Norwegian Journal of Geology – online:
Sediment characteristics and environmental implications
in the Lofoten - Barents Sea region
"In this issue of NJG we present papers focusing on (sub-) recent geological and biological characteristic of the Lofoten - Barents Sea region. This theme covers a wide range of studies ranging from large-scale submarine landscape evolution to small-scale biological diversity. A common aspect of most papers is the attempt to describe the interaction of geological and biological processes in the Lofoten - Barents Sea region and the implications these have for environmental changes. Most of the research has been performed under the umbrella of the MAREANO (Marine AREal Database for NOrwegian Waters) program, its first phase from 2005 to 2010 being funded by the Norwegian Government." Read the articles here: NJG 2009 Volume 89 Nr. 1 & 2
...men forskere får ikke miljøkartlagt havbunnen utenfor Lofoten før regjeringen skal vurdere oljeboring.... "I 2004 opprettet myndighetene havforskningsprosjektet Mareano. Mareano skulle kartlegge biologisk mangfold på havbunnen i nordområdene. Men på grunn av lave bevilgninger over mange år, blir ikke prosjektet ferdig. Blant annet vil ikke Nordland 6 bli kartlagt i det hele tatt." Les mer i Hundre millioner mangler (Dagbladet 17.8.2009)
Nyhet 10.09.09: Arbeidet med de 17 første områdene i Nasjonal marin verneplan er i gang. Planen er den første i sitt slag for å verne undersjøisk natur.Les mer her:Skal verne natur under vann
Sweeden has enviromental informaton on their coastal areas at this page: Havsmiljøn and on the viewer Vattenkartan
See also: The EU Water Framework Directive and Breathless coastal seas, and for the Baltic Sea:
WWF: Baltic Ecoregion Programme
Documentary on cod fishing in the Baltic Sea


 På Bent Svinnung's interaktive kart som finner du lenker til noen av hans favorittplasser, fra Helgelandskysten til yttersia av Troms, samt en del informasjon om beliggenhet, tilgjengelighet, praktiske tips, historikk. Jeg har stor glede av å klikke på de hvite punktene på dette kartet og studere turbeskrivelser og se fantastiske bilder. Yttersida av Troms er et eldorado for dem som bedriver turliv, uansett om framdriften skjer med åre, seil, motor eller beina. Masse rullesteinsfjærer, sandstrender, holmer og skjær, egger og vegger. Nok til å ta pusten fra de aller mest blaserte.
Turliv på Yttersia,

"A walk through H: The Reincarnation of an Ornithologist " by Peter Greenaway is a 40-minute abstracted journey film, told almost entirely through the use of a series of 92 maps, - A friend of mine showed me this short film when I was studying architecture at BAS in early nineties and it is still one of my favourites. The film is "set" entirely in the world of "H," which is represented only by Tulse Luper's maps, sprinkled with occasionally intercuts with images of birds and sunsets. The panning along the paper surfaces of the imaginary maps is intriguingly fascinating and so is the narrator’s absurd dry voice describing how he came to possess each of these maps, and what his journey is like.
At the official website, petergreenaway.org.uk you can read Greenaway’s own idea about A Walk through H: "I've always been fascinated by maps and cartography. A map tells you where you've been, where you are, and where you're going - in a sense it's three tenses in one. It's also an amazing ideogram of information that is very useful and, perhaps most pertinently, also not at all useful. My father had recently died, and the subtitle of the film was 'The Reincarnation of an Ornithologist' - my father was one. Through his life he had amassed an extraordinary amount of information about bird study, and I was very aware that with his death - as indeed with any death - a vast amount of very personalized information had gone missing, was totally irrecoverable. The film is on the journey a soul takes at the moment of death, to whatever other place it ends up - H being either Heaven or Hell. I devised 92 maps to help this particular character get there. The whole film was divided into five sections that represented movement from a very urban landscape to a wilderness landscape, and there were references and cross-references to all sorts of systems."
Follow this link to A Walk Through H: The Reincarnation of an Ornithologist